Import
ImageLog Import
GeoSlicer module for loading profile data in DLIS, LAS, and CSV, as described in the steps below:
-
Select the well log file under Well Log File.
-
Edit Null values list and add or remove values from the list of possible null values.
-
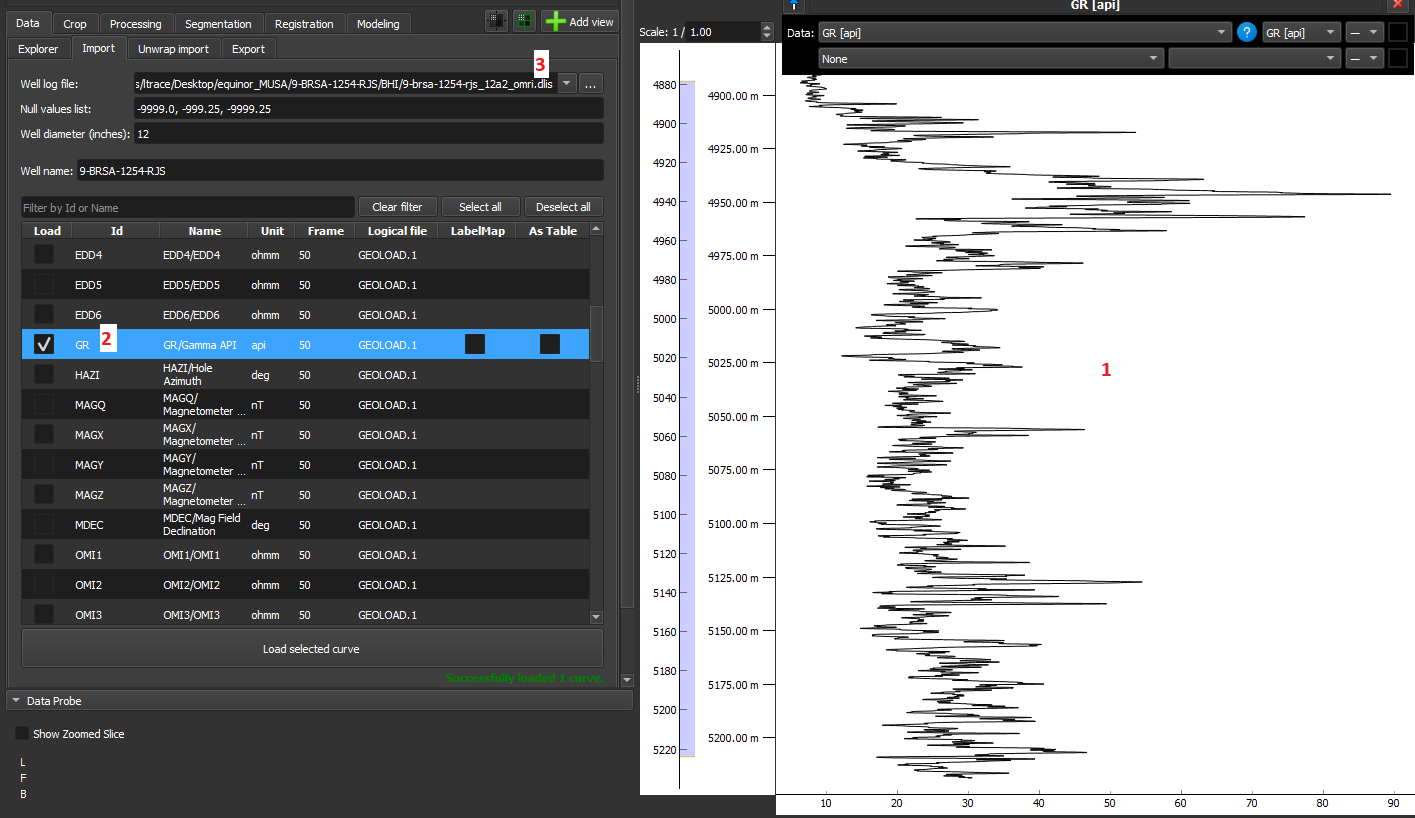
Choose the desired profiles to be loaded into GeoSlicer, according to each option described below:
- 1-D data should be loaded without selecting the “As Table“ and “LabelMap” options and are displayed as line graphs in the Image Log View.
-
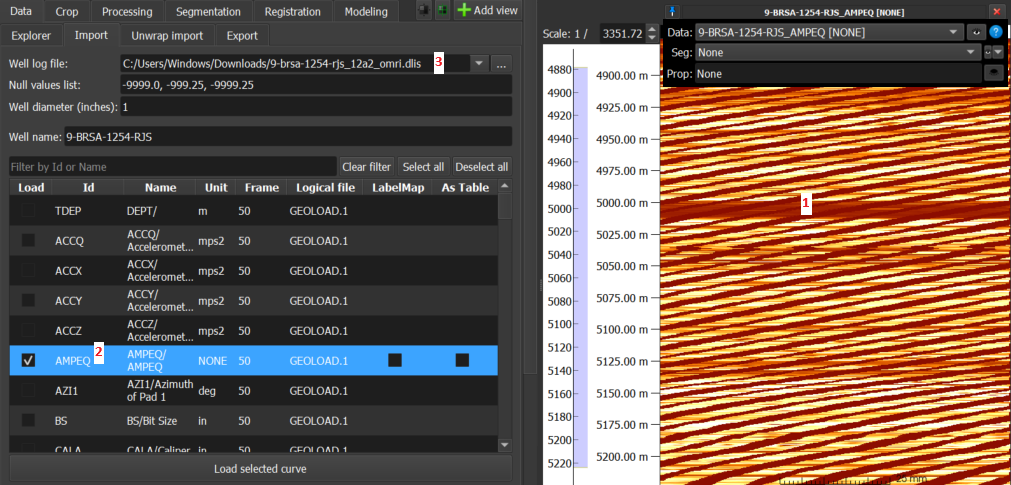
2-D data can be loaded as volumes, tables, or LabelMap in GeoSlicer, with each of the options detailed below:
- Volume: This is the default GeoSlicer option, without checking 'As Table' and 'LabelMap', where the data is loaded as a volume and displayed as an image in the Image Log View.
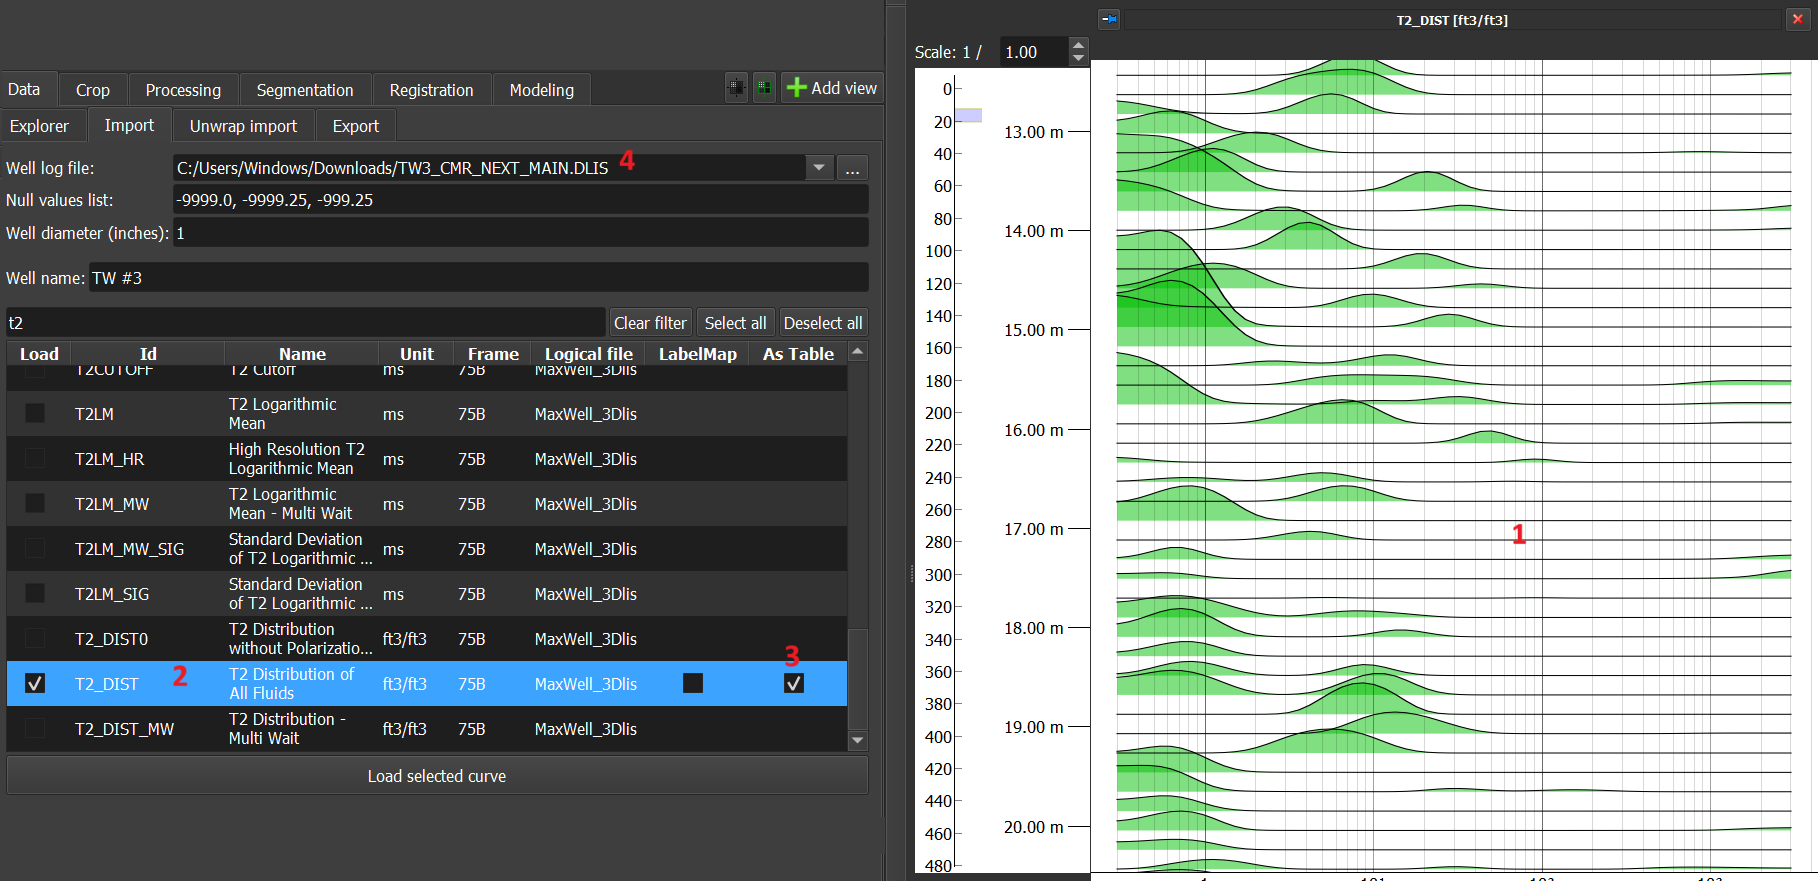
- Tables: In this option, by checking the 'As Table' checkbox, the data is loaded as a table and is displayed as several histograms, as in the case of the t2_dist data in Figure 3 below:
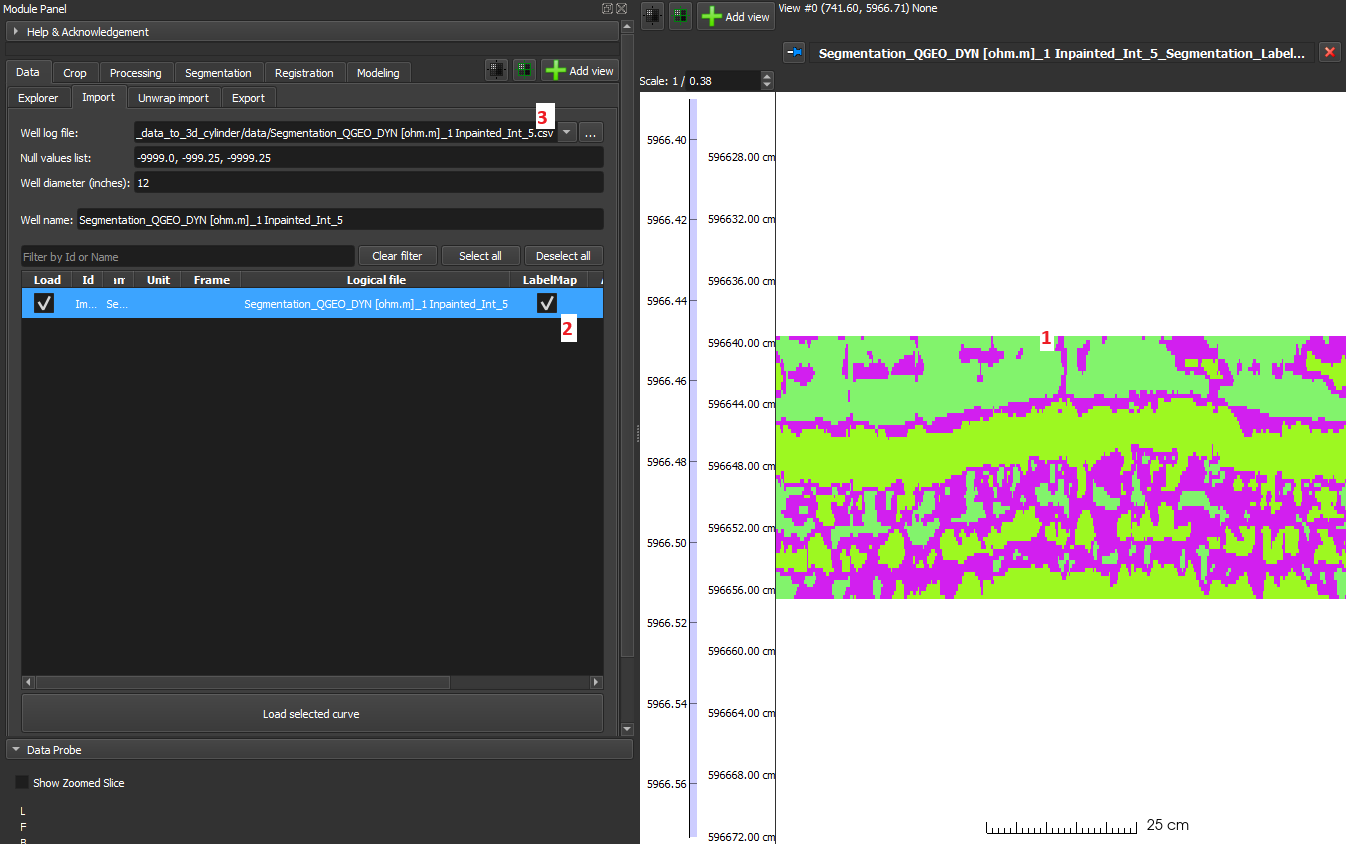
- LabelMap: In this option, by checking the 'LabelMap' checkbox, assuming segmented data, it is loaded as a LabelMap and displayed as a segmented image.
- Volume: This is the default GeoSlicer option, without checking 'As Table' and 'LabelMap', where the data is loaded as a volume and displayed as an image in the Image Log View.
- 1-D data should be loaded without selecting the “As Table“ and “LabelMap” options and are displayed as line graphs in the Image Log View.
Formatting of files to be loaded
LAS
Sequential curves with mnemonics in the format mnemonic[number] will be grouped into 2-D data. For example, the mnemonics of an image with 200 columns:
AMP[0]
…
AMP[199]
The same file can contain both 1-D and 2-D data. In the following example, AMP is an image, while LMF1 and LMF2 are 1-D data:
AMP[0]
…
AMP[199]
LMF1
LMF2
CSV
For GeoSlicer to interpret CSV data as 2-D, the mnemonics simply need to be of the same name followed by an index in square brackets, as in the 1st example of the LAS section above (AMP[0], …, AMP[199]). Unlike the LAS case, the file must contain only 2-D data.