Well Logs Environment
The Well Logs environment is designed for the visualization and analysis of well log data, such as image logs and curves.
Data Visualization
The main feature of this environment is the ability to display multiple logs side by side, all synchronized by depth.
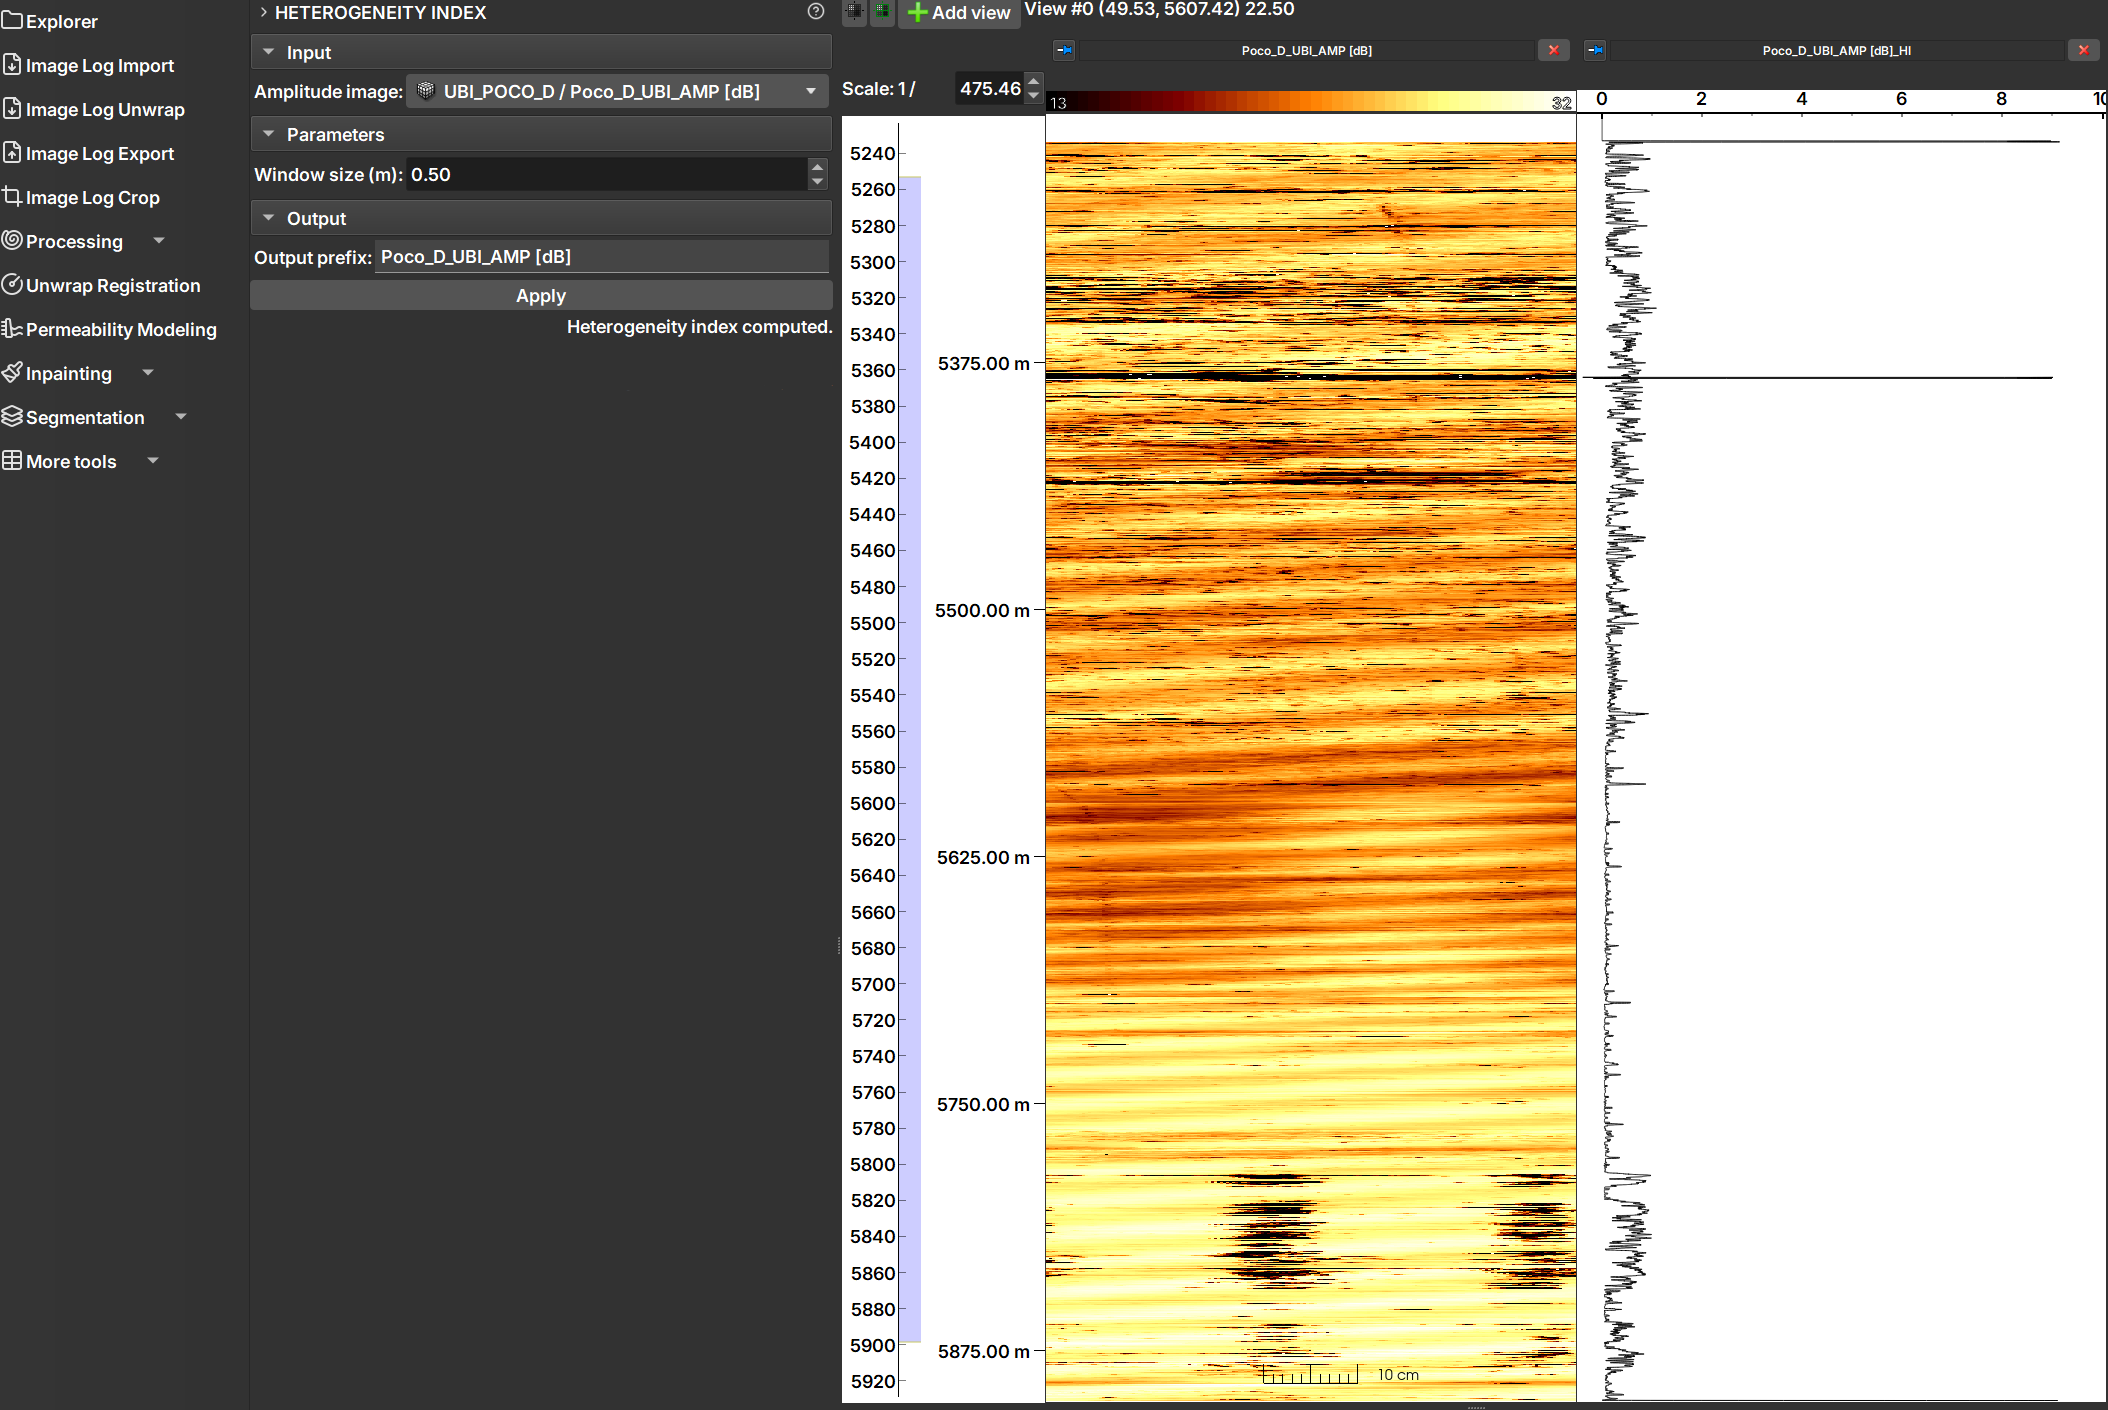 Well Log environment, showing an image (left) and a curve (right) aligned by depth.
Visualization Types
- Images: 2D logs, such as well images, are displayed as images in a vertical track.
- Tables: Tables of values by depth are displayed as a curve.
- Histograms: It is possible to visualize multiple histograms at different depths in a single track, for example, results from the Charts module.
Navigation and Interaction
- Depth Axis: A vertical depth axis is displayed on the left, serving as a reference for all logs.
- Synchronization: Scrolling and zooming are synchronized across all tracks, allowing for comparative analysis at different depths.
- Add/Remove Tracks: To add a new visualization track, select the desired data in the "Explorer" panel and click the "Add view" button in the toolbar. To remove, use the close button in the track header.
Sections
The GeoSlicer Well Logs environment is organized into several modules, each dedicated to a specific set of tasks. Click on a module to learn more about its functionalities:
- Import: To load well log data in DLIS, LAS, and CSV formats.
- Unwrap: To rectify well images.
- Export: To export processed data.
- Crop: To crop image data.
- Processing: Tools to apply filters and corrections, such as:
- Eccentricity: For eccentricity correction.
- Spiral Filter
- Quality Indicator
- Heterogeneity Index
- Azimuth Correction
- CLAHE (Contrast Limit Adaptive Histogram Equalization): For contrast enhancement.
- Unwrap Registration: To register rectified images.
- Permeability Modeling: To calculate permeability from image attributes.
- Inpainting: To fill gaps in the image.
- Segmentation: Modules for segmenting well images:
- Segment Editor: Manual and semi-automatic tools for segment editing.
- Instance Segmenter: Automatic segmentation based on machine learning.
- Instance Editor: Tools to refine instance segmentation results.
- Additional Tools:
What you can do?
With the GeoSlicer Well Logs environment, you can:
- Visualize and analyze well log data, such as image logs and curves.
- Apply filters and corrections to the data.
- Segment well images to identify different features.
- Calculate permeability from image attributes.
- Export processed data.