Note
Some features presented on this page will only be available in the private version of GeoSlicer. Learn more by clicking here.
Microtom
The Microtom module integrates the MicroTom simulation library, developed by Petrobras, into GeoSlicer. It offers a set of advanced tools for analyzing porous media, allowing detailed characterization of petrophysical properties from digital images.
The main available methods are described below:
PNM Complete Workflow
Executes the complete Pore Network Model (PNM) workflow, from network extraction to property simulation and interactive report generation.
Input Parameters:
-
Image: Can be either a Scalar Volume, representing the porosity map, or a LabelMap Volume, representing individualized pores. In the first case, a multiscale model will be considered, while in the second, a single-scale model will be considered (simpler, disregards sub-resolution porosity).
-
Sensibility Test Parameters: By clicking "Edit", a window will open for choosing the parameter intervals used in the simulations, including parameters that control the distribution of contact angles, interfacial tension, and other simulation control parameters.
-
Subscale Model: When in multiscale simulation, with the porosity map as input, it controls the model for the radii of pores and throats attributed in sub-resolution.
-
Well Name: Identification used to facilitate analysis across different samples.
Outputs:
-
Streamlit Report: The results of the analyses performed on this sample are added to the Streamlit report pages.
-
Output Nodes: Table nodes and Pore Network Model (PNM) nodes, as well as the results of various simulations (absolute permeability, relative permeability, mercury injection), are added to the Slicer scene.
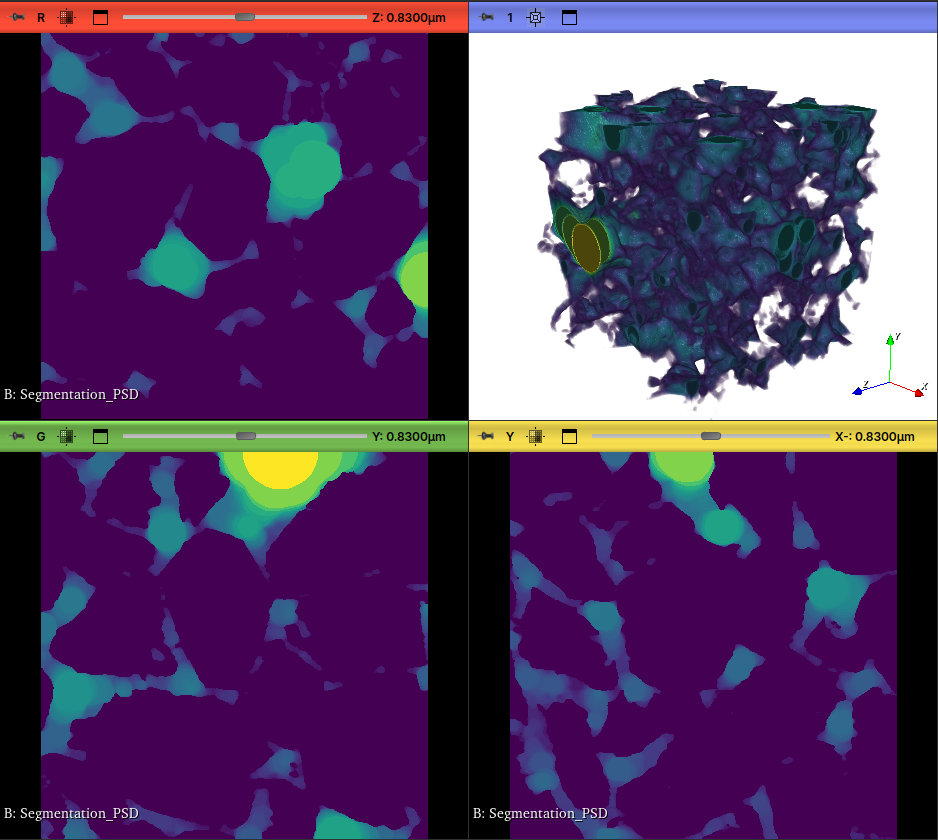
Pore Size Distribution
This method analyzes a binary (segmented) image and calculates the pore size distribution using the maximum spheres algorithm, based on the method of maximum inscribed spheres in a binary porous medium. The selected segment is considered as the pore space. It is a quick way to characterize the geometry of the pore space.
Input Parameters:
- Input Volume: Volume containing the porous medium, typically the MicroCT image itself.
- Pore Segment: The specific segment representing the pore space to be analyzed.
- Saturation Resolution: Defines the discretization of saturation in the PSD curve.
- Radius Resolution: Defines the discretization of the calculated radii in the PSD curve.
- Saturation correction: Optional argument for correcting saturation using the table with the porosity map.
Outputs:
- PSD Volume: A volume showing the overlap of maximum spheres over the pore space.
- Distribution Table: A table containing pore radii in voxels and the estimated saturation of wetting and non-wetting fluid.
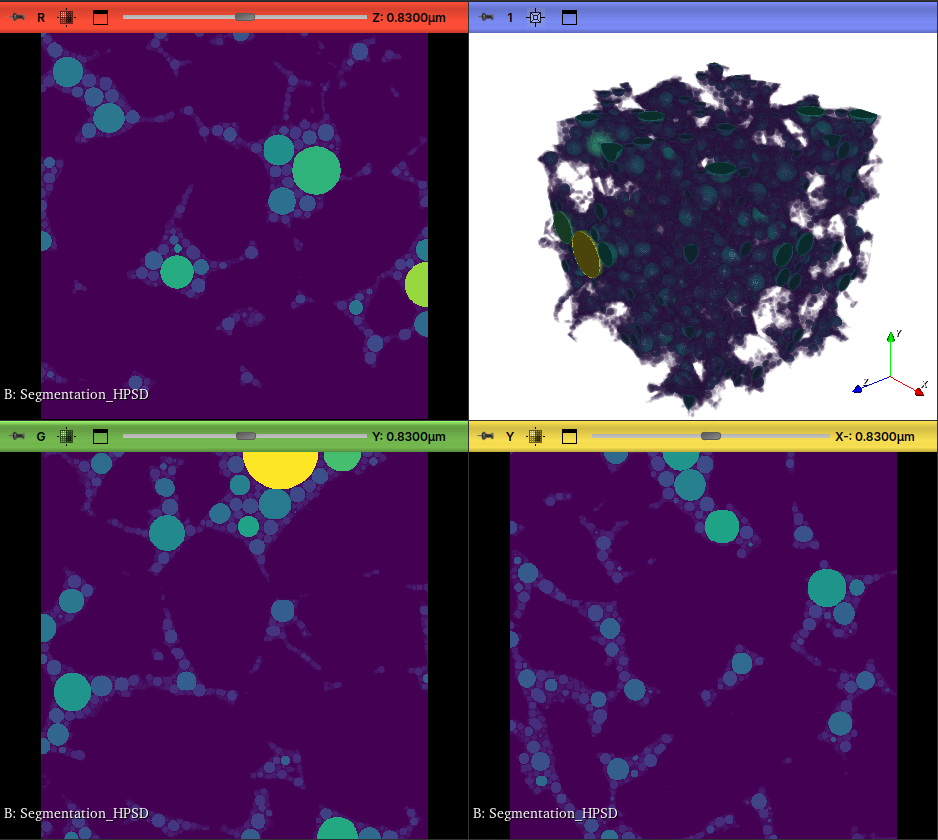
Hierarchical Pore Size Distribution
Analyzes the hierarchical distribution of pores distributed in the pore space. In this case, the spheres will be distributed so as not to intersect each other.
Input Parameters:
- Input Volume: Volume containing the porous medium, typically the MicroCT image itself.
- Pore Segment: The specific segment representing the pore space to be analyzed.
- Saturation correction: Optional argument for correcting saturation using the table with the porosity map.
Outputs:
- PSD Volume: A volume showing the arrangement of maximum spheres over the pore space.
- Distribution Table: A table containing pore radii in voxels and the estimated saturation of wetting and non-wetting fluid.
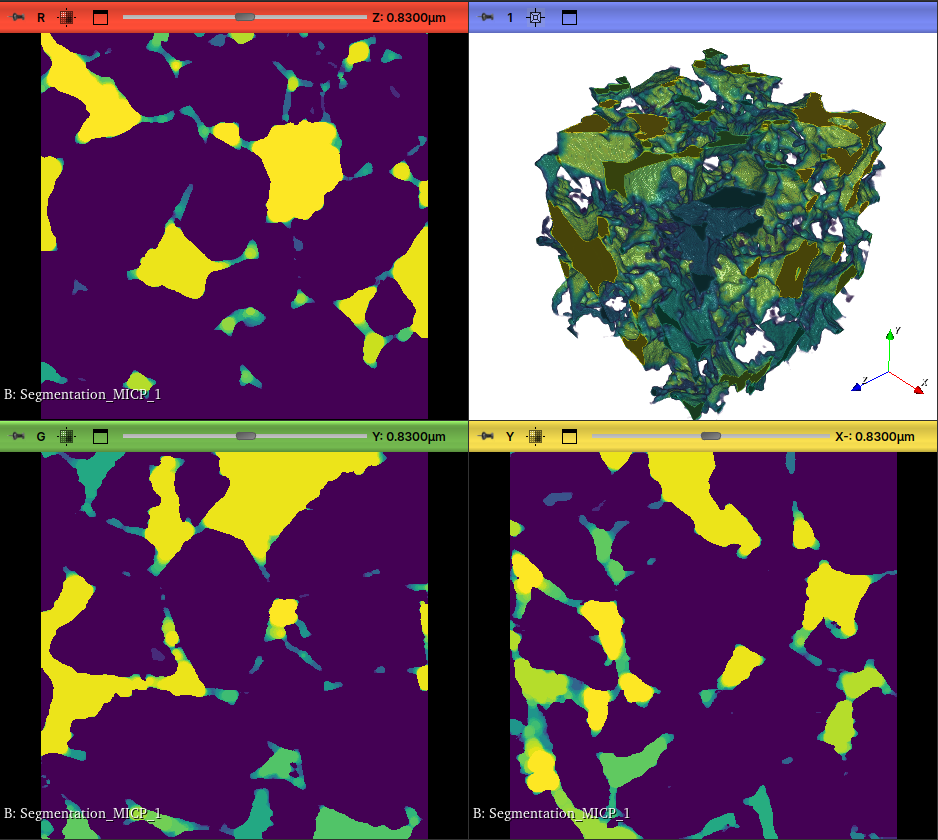
Mercury Injection Capillary Pressure
Calculates mercury injection capillary pressure based on the radii of the maximum spheres that fill the binary porous medium and are connected to an entry face.
Input Parameters:
- Input Volume: Volume containing the porous medium, typically the MicroCT image itself.
- Pore Segment: The specific segment representing the pore space to be analyzed.
- Direction: The direction of the faces at which pore connectivity will be analyzed.
- Saturation Resolution: Defines the discretization of saturation in the PSD curve.
- Radius Resolution: Defines the discretization of the calculated radii in the PSD curve.
- Saturation correction: Optional argument for correcting saturation using the table with the porosity map.
Outputs:
- MICP Volume: A volume showing the capillary pressure estimated by the maximum spheres method.
- Table: A table with radius values and the corresponding mercury saturation (Snw).
Incompressible Drainage Capillary Pressure
Simulates the primary drainage process, where a non-wetting fluid displaces a wetting fluid, considering the fluid as incompressible. In this method, irreducible water saturation (Swi) is non-zero, as part of the wetting phase gets trapped with increasing capillary pressure.
Input Parameters:
- Input Volume: Volume containing the porous medium, typically the MicroCT image itself.
- Pore Segment: The specific segment representing the pore space to be analyzed.
- Direction: The direction of the faces at which pore connectivity will be analyzed.
- Saturation Resolution: Defines the discretization of saturation in the PSD curve.
- Radius Resolution: Defines the discretization of the calculated radii in the PSD curve.
- Saturation correction: Optional argument for correcting saturation using the table with the porosity map.
Outputs:
- Volume: A volume showing the capillary radius estimated by the maximum spheres method.
- Table: A table with radius values and the corresponding saturation.
Imbibition Capillary Pressure
Simulates the imbibition process. The calculation assumes no non-wetting phase trapping (Sor = 0), meaning it is fully displaced as capillary pressure decreases.
Input Parameters:
- Input Volume: Volume containing the porous medium, typically the MicroCT image itself.
- Pore Segment: The specific segment representing the pore space to be analyzed.
- Direction: The direction of the faces at which pore connectivity will be analyzed.
- Saturation Resolution: Defines the discretization of saturation in the PSD curve.
- Radius Resolution: Defines the discretization of the calculated radii in the PSD curve.
- Saturation correction: Optional argument for correcting saturation using the table with the porosity map.
Outputs:
- Volume: A volume showing the capillary radius estimated by the maximum spheres method.
- Table: A table with radius values and the corresponding saturation.
Incompressible Imbibition Capillary Pressure
Simulates the imbibition process considering non-wetting phase trapping (Sor > 0), which is more representative of real processes in porous media, as capillary pressure decreases.
Input Parameters:
- Input Volume: Volume containing the porous medium, typically the MicroCT image itself.
- Pore Segment: The specific segment representing the pore space to be analyzed.
- Direction: The direction of the faces at which pore connectivity will be analyzed.
- Saturation Resolution: Defines the discretization of saturation in the PSD curve.
- Radius Resolution: Defines the discretization of the calculated radii in the PSD curve.
- Saturation correction: Optional argument for correcting saturation using the table with the porosity map.
Outputs:
- Volume: A volume showing the capillary radius estimated by the maximum spheres method.
- Table: A table with radius values and the corresponding saturation.
Absolute Permeability
Note
Closed source, available only in the Petrobras environment.
Calculates the absolute permeability of the sample by simulating single-phase fluid flow through the pore network using a Stokes flow simulation. The simulation solves the Stokes equations for flow in each pore.
Absolute Permeability - Representative Elementary Volume
Note
Closed source, available only in the Petrobras environment.
This method helps determine the Representative Elementary Volume (REV) for absolute permeability. It performs the absolute permeability calculation on multiple subvolumes of increasing sizes and plots the result, allowing verification of the sample size at which the property becomes statistically stable.
Absolute Permeability - Darcy FOAM
Note
Closed source, available only in the Petrobras environment.
Simulates flow through the porous medium from a permeability map, where each voxel will have a permeability value. It uses a proprietary solver developed by Petrobras.
Relative Permeability
Note
Closed source, available only in the Petrobras environment.
Simulates two-phase flow (e.g., oil and water) in a pore network to calculate relative permeability curves. It uses a proprietary solver developed by Petrobras.