More Tools
Volume Calculator
The Volume Calculator module performs mathematical and logical operations using the volumes loaded in the project. It is a flexible tool for combining, modifying, and analyzing volumetric data through custom formulas.
Step 1: Write the Formula
- Locate the volumes you want to use. You can use the filter field to find them more easily.
- In the Formula field, type the desired mathematical expression.
- To insert a volume into the formula, type its name exactly as it appears in the data tree, enclosing it in curly braces
{}. Alternatively, double-click on the volume name in the data tree to have it automatically inserted into the Formula field.
Here are some examples of valid formulas:
-
Simple arithmetic operation:
This formula adds the values of{Volume1} + log({Volume2})Volume1with the logarithm of the values ofVolume2. -
Mask creation (thresholding):
This formula generates a new binary volume (mask). Regions where{Volume1} < 10000Volume1values are less than 10000 will receive the value 1, and the others will receive the value 0. -
Mask application:
This formula first creates a mask for({Volume1} > 13000) * {Volume1}Volume1values greater than 13000 and then multiplies this mask by the originalVolume1. The result is a volume where values below the threshold are zeroed out.
Complete list of available operators and functions
Step 2 (Optional): Use Mnemonics
If volume names are too long or complex, you can use mnemonics (aliases) to simplify writing the formula.
- Expand the Mnemonics section.
- Click on the Mnemonic Table selector to choose an existing table or create a new one.
- If you create a new table, it will appear in the preview area. Double-click on the cells to edit and associate a Volume name with a Mnemonic.
- Use the Add mnemonic and Remove selected mnemonics buttons to add or remove rows from the table.
- With a mnemonic table selected, when you double-click on a volume in the data tree, its mnemonic will be inserted into the formula instead of its full name.
Note
Mnemonic tables are saved in the GeoSlicer scene within a folder called Volume Calculator Mnemonics, allowing them to be reused in future calculations.
Step 3: Define the Output Volume
- In the Output volume name field, type the name for the new volume that will be generated with the calculation result.
Step 4: Execute the Calculation
- Click the Calculate button.
- The operation will be executed, and a status bar will show the progress.
- At the end, the new output volume will be added to the scene, usually in the same folder or directory as the first volume used in the formula.
Geometry Alignment (Resampling)
If the volumes used in the formula have different geometries (distinct dimensions, spacing, or origin), all volumes will be automatically resampled temporarily to match the geometry of the first volume listed in the formula. Although this resampling is necessary for the calculation, it can introduce interpolation into the data. Verify that the order of the volumes in the formula is in accordance with the expected result.
NetCDF
The NetCDF module provides a set of tools for working with the NetCDF file format (.nc), which is used in GeoSlicer to store multiple volumes, segmentations, and tables in a single self-contained file.
The main advantage of using the NetCDF format is the ability to group related data into a single file. For example, you can save an original image volume and multiple segmentations or analyses (such as porosity tables) together. This keeps all your project data organized and portable, facilitating sharing and archiving.
Additionally, NetCDF is a standard and self-describing data format, widely used in scientific applications. This means that .nc files generated by GeoSlicer can be easily opened and processed by other external tools and libraries, such as xarray and netCDF4 in Python, enabling customized analysis workflows.
Features
The module is divided into three main tabs:
- Import: Allows loading data from a NetCDF (
.nc) or HDF5 (.h5,.hdf5) file into the scene. - Save: Allows saving new images or tables from a project folder back to the original NetCDF file from which they were imported. This operation modifies the existing file.
- Export: Allows exporting one or more items from the scene to a new NetCDF file.
Integration with Other Modules
NetCDF files integrate with other GeoSlicer modules for advanced workflows:
- It is possible to import a NetCDF file using the Micro CT Loader.
- For NetCDF files containing images too large to fit into memory, you can use the Big Image module to view and process them efficiently.
NetCDF Import
The Import tab is used to load data from NetCDF (.nc) or HDF5 (.h5, .hdf5) files into GeoSlicer.
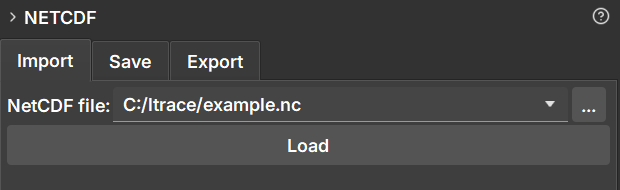
How to Use
- Navigate to the NetCDF module and select the Import tab.
- Click the file selection button next to "NetCDF file:" to open the file explorer.
- Select the
.nc,.h5, or.hdf5file you want to load. - Click the Load button.
Behavior
When loading a file, GeoSlicer creates a new folder in the data hierarchy with the same name as the file. All volumes, segmentations, and tables contained within the NetCDF file are loaded into this folder.
This project folder is linked to the original file. This linking is essential for the Save functionality, which allows updating the original file with new data generated in GeoSlicer.
NetCDF Export
The Export tab allows you to save one or more scene items (volumes, segmentations, tables) into a new NetCDF (.nc) file. It is the ideal tool to create a new dataset from results generated or modified in GeoSlicer.
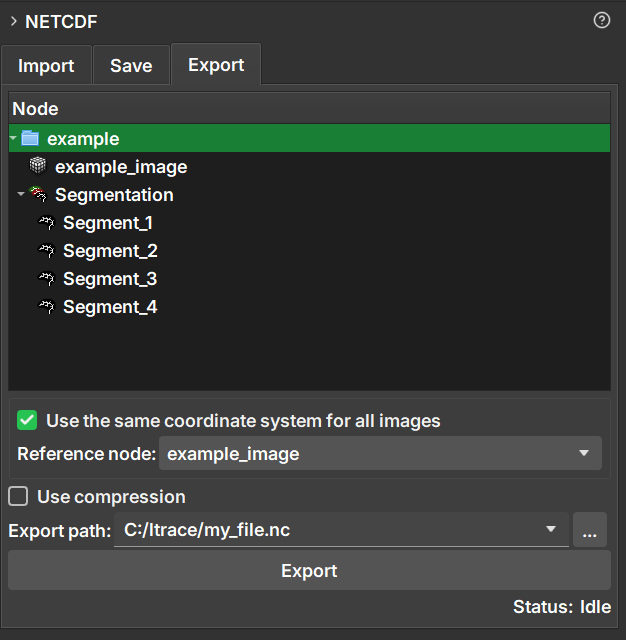
How to Use
- Navigate to the NetCDF module and select the Export tab.
- In the data hierarchy tree displayed in the module, select the items you wish to export. You can select individual items (such as volumes or tables) or entire folders to export all their content.
- Choose the destination path and the name of the new file in the Export path field.
- Configure the export options as needed (detailed below).
- Click the Export button.
Export Options
-
Use the same coordinate system for all images:
- When checked, this option ensures that all exported images are spatially aligned. Images are resampled to fit a common coordinate system, defined by the Reference node.
- This is useful for ensuring alignment, but it can increase the file size if images have very different orientations or spacings, due to the need for padding.
- If unchecked, each image is saved with its own coordinate system, which can result in a smaller file.
-
Reference node:
- Enabled only when the option above is checked.
- Select an image (volume) that will serve as a reference for the coordinate system. All other images will be aligned to this one.
-
Use compression:
- When checked, applies compression to the data, which reduces the final file size.
- Compression can make the process of saving and loading the file slightly slower.
Difference between Export and Save
- Export always creates a new
.ncfile. - Save modifies an existing
.ncfile that was previously imported.
Save Data to an Existing NetCDF File
The Save tab offers a way to update a NetCDF file (.nc) that was previously imported into GeoSlicer. It allows you to add new items (such as volumes, segmentations, or tables) from a project folder back to the original file, modifying it directly.
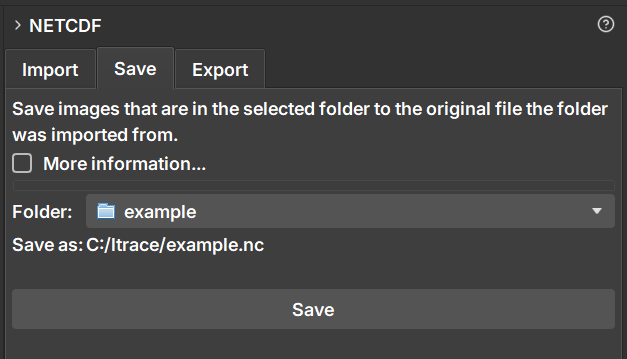
The main motivation for using the Save functionality is to be able to save changes or new data (such as a newly created segmentation) back to the original NetCDF file, preserving all existing attributes, metadata, and coordinate structure. Unlike the "Export" option, which creates an entirely new file, "Save" only appends the new data, ensuring that consistency with the original file is maintained. This is ideal for iterative workflows where you enrich an existing dataset without losing the original context.
How to Use
The Save functionality is designed for a specific workflow:
- First, import a NetCDF file using the Import tab. This will create a project folder in the data hierarchy.
- Work on your project. You can, for example, create a new segmentation for a volume that was in the file or drag a new volume into the project folder.
- Navigate to the NetCDF module and select the Save tab.
- In the Folder field, select the project folder that corresponds to the file you want to update.
- The Save as: field will be automatically populated with the original file path, confirming where the changes will be saved.
- Click the Save button.
Behavior
- The operation modifies the original file. It is recommended to create a backup if you need to preserve the file's previous state.
- Only new items within the project folder that do not yet exist in the
.ncfile will be added. - Items that were already in the file are not overwritten or deleted.
- Newly added images are automatically resampled to align with the coordinate system of the data already existing in the file.
Difference between Save and Export
- Save modifies an existing
.ncfile, preserving its structure and metadata. - Export always creates a new
.ncfile.
Workflows
Tables
In addition to visual reports, Geoslicer allows the export of data tables derived from the analyses performed. These tables are vital for detailed documentation of results, enabling quantitative and comparative analysis, and are easily integrated with other analysis software.
The Tables icon is used to edit tables, as described in the steps below:
- Click on the table icon.
- Browse table data through the interactive window
- In the Calculator section, describe the operation between the columns and the column that will be modified/added
- Click on Calculate to modify the table according to the formula from the previous step.
Graphs
The Graphs icon in GeoSlicer is used for data visualization through various types of graphs, allowing the generation of graphs from data contained in tables. Available graph types include crossplots, rose diagrams, and bar charts. The module's interface allows users to select data tables, choose a graph type, and display multiple datasets on the same graph. The graph interface allows interactive customization, such as adjusting scales and selecting properties for the X, Y, and Z axes.
- Click on the Graph icon.
- Select a table with the data to be used in the plot
- In Plot type, choose the ideal plot type to be rendered with your data
- Click on Plot
- Name your plot and click on Ok
- In the data section, select the column to be plotted
- The options Bins, Show mean and standard deviation and Log mode can be used to improve data visualization
Multiple Image Analysis Module
The Multiple Image Analysis module is an advanced Geoslicer tool, designed to generate custom reports based on different types of image analyses. It supports analyses such as histograms, depth averages, and basic petrophysics. Users can select the desired analysis type through an intuitive interface, load directories containing thin section images, and configure specific options for each analysis type. After processing, the module generates detailed reports that can be viewed and exported for later use. The flexibility in choosing different analysis types allows geologists to gain comprehensive and detailed insights into the properties of the studied rocks.