Export Tools
Note
Some features presented on this page will only be available in the private version of GeoSlicer. Learn more by clicking here.
ImageLog Export
The Image Log Exporter module is used to export well log data, such as scalar volumes, segmentations, and tables, into industry-standard file formats.
The main purpose of this module is to allow data processed or generated in GeoSlicer to be easily transferred to other software specialized in well log analysis, such as Techlog or Geolog. It ensures that the data is converted into compatible formats, preserving its structure and essential information.
How to Use
- Select Data: In the data hierarchy tree, select the items (volumes, segmentations, or tables) you want to export. You can select multiple items.
- Associated data: If a selected item has any associated data, the Associated data option will be available and will allow you to choose the types of data to be exported together. Currently, only Proportions data is available.
- Well log: Define the output format for any selected well log data (e.g.:
LAS,DLIS,CSV). - Table: Define the output format for the selected tables, if any.
- Ignore directory structure (Optional): Check the Ignore directory structure option if you want all files to be saved directly into the export directory, without recreating the project hierarchy's folder structure.
- Select Export Directory: In the Export directory field, choose the folder where the files will be saved.
- Click Export: Press the Export button to start the process.
Output Formats
Well Logs
- DLIS: Industry-standard format for well logging data.
- CSV (matrix format): Exports data in a "wide" spreadsheet format, where each row represents a single depth value given in the first column, while the other columns represent values at that depth. Example of matrix CSV:
MD,Volume[0],Volume[1] 10.0,50,60 10.1,52,62 - CSV (Techlog format): Generates a CSV file in a specific format, optimized for import into Techlog software. It is a "flattened" format, where multiple values at the same depth are stored as multiple rows. Example of Techlog CSV:
depth,intensity m,HU 10.0,50 10.0,60 10.1,52 10.1,62 - LAS: Another widely used standard text format for well log data.
- LAS (for Geolog): A variation of the LAS format, adjusted for better compatibility with Geolog software.
Tables (Table)
- CSV: Standard comma-separated values format, compatible with most spreadsheet and data analysis software.
MicroCT Export
This module provides a series of export formats for volumes loaded or generated by GeoSlicer, facilitating integration with other software or saving the results.
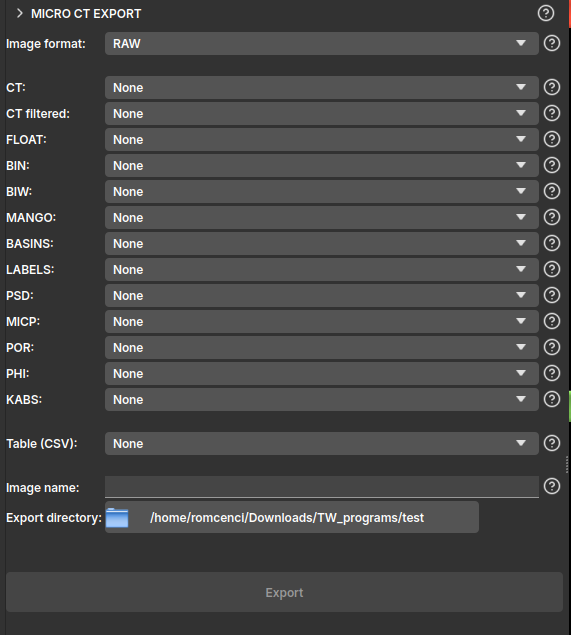
The module's interface is presented simply, where the user can select one of the export formats:
- RAW: Raw binary files. Supports /scalar/ volume, /labelmap/, and segmentations. Exports a separate file for each volume with the standard nomenclature;
- TIF: TIFF files. Supports only /scalar/ volume. Exports a separate file for each volume with the standard nomenclature;
- NetCDF: NetCDF files. Supports /scalar/ volume, /labelmap/, and segmentation. Exports a single
.ncfile containing all volumes;
The interface is also designed to operate following a standard nomenclature, defined by Petrobras, which follows the logic below:
- CT: image with 16-bit unsigned integer values, typically the sample's own CT;
- CT filtered: cropped or filtered image based on the original, also with 16-bit unsigned integer values;
- FLOAT: image with 32-bit real values, usually representing a component of the velocity field or pressure;
- BIN: 8-bit binary image, typically 1 representing pore and 0 the solid;
- BIW: 8-bit binary image, inverting the BIN classification, 1 represents the solid and 0 the pore;
- MANGO: 8-bit binary image, 0 and 1 represent the pore, while 102 and 103 are solid, intermediate values between 1 and 102 are linearly distributed in the image and inversely proportional to the sample's porosity;
- BASINS: segmented image, typically with integer values, where segments are defined as: 1 = Pore, 2 = Quartz, 3 = Microporosity, 4 = Calcite, 5 = High attenuation coefficient;
- LABELS: 8-bit image representing a label map or segmentation, assigning a unique identifier for each connected component or segmented region;
- PSD: 16-bit image with integer values representing the maximum sphere diameter that contains the point and remains completely within the segmented porous medium;
- MICP: 16-bit image with integer values representing the maximum sphere diameter that reached the point from one of the edges of the segmented porous medium;
- POR: 32-bit image with real values representing the local porosity of the sample, point by point, varying between 0 and 1;
- PHI: 32-bit image with real values that can represent the sample's porosity;
- KABS: 64-bit image with real values representing the absolute permeability field of the sample;
- Table (CSV): Exports a table from GeoSlicer to a
.csvfile with the same name as the node;
After selecting the folder where you want to create the files, click Export.
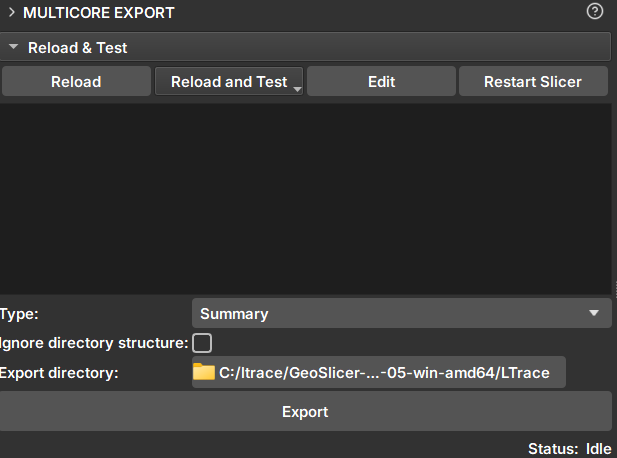
Multicore Export
GeoSlicer module to export the summary, core slices, and unfolded images of cores.
Panels and their use
 |
|---|
| Figure 1: Multicore Export Module. |
Inpaint
-
Selector: Selects one or more volumes for export.
-
Type: Data type to be exported. Available options:
- Summary: Creates an html file for viewing core information.
- CSV: In two formats with depth columns and image CT intensities. One of them is compatible with Techlog software.
- PNG: Export option for the unfolded image.
- TIF: .tiff file of the core volume.
-
Ignore directory structure: If selected, all files will be saved in the selected directory, without creating new sub-directories.
-
Export directory: Directory where the files will be saved
-
Export: Exports to the chosen directory.